Reaching new heights: Catalyst CEO Champions For Change

Executive summary
Our eighth annual report shows that the 80+ CEOs and their companies who make up the Catalyst CEO Champions For Change, representing nearly 11 million employees and earning more than $3 trillion in annual revenue, are strong in their commitment to creating workplaces where all talent can thrive. While there are challenges, they are pushing forward because they know that the benefits of workplaces primed to tap into the full spectrum and potential of talent — to the benefit of all employees and businesses — is clear and unchanging. Our data show that they are closing retention gaps and monitoring fair pay, and they are ensuring that they have the best teams in place to meet the challenges of both today and tomorrow.
Champions continually push forward
Champions don’t rest on their laurels. They push forward, always striving to reach new heights, innovating new ways to do better. And that is what the Catalyst CEO Champions For Change continue to do. In our eighth annual survey of these 80+ CEOs and their companies, which represent nearly 11 million employees and earn more than $3 trillion in annual revenue, we find that their commitment to closing talent gaps is stronger than ever.1
The results show that for Champion companies, workplace fairness is a core leadership and organizational value that is fundamental to how they do business. They are motivated by the conviction that their employees, customers, communities, and other stakeholders are better off when opportunities to thrive are accessible to everyone. And they have not been deterred by alarmist headlines proclaiming the demise of workplace inclusion initiatives. Across all regions and industries, the Catalyst CEO Champions For Change are showing the world what true champions look like.
Champion companies continue to dedicate resources to diversity and inclusion
Headlines proclaiming that companies are backing away from inclusion work distract from the ongoing dedication of many businesses, including Champion companies, to eradicating biases and creating workplaces where everyone can thrive.
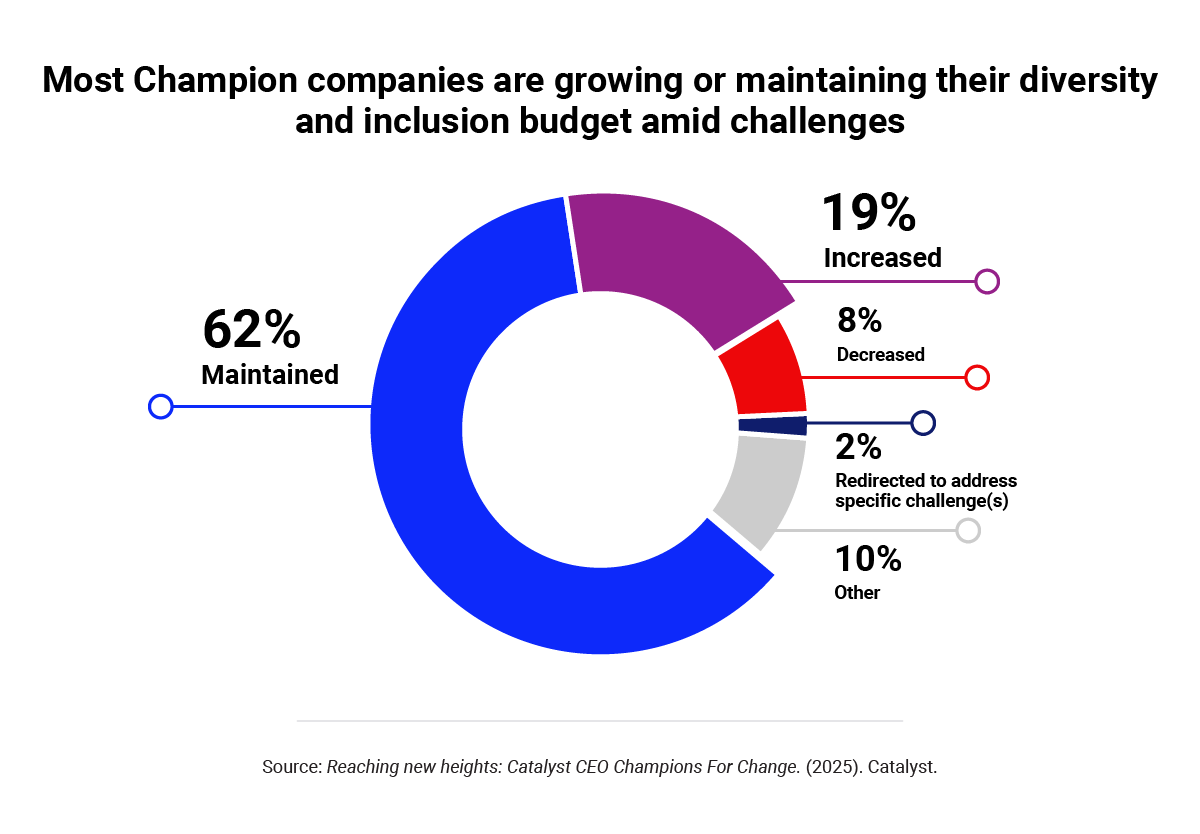
Although a large majority of Champion companies (79%) experienced some degree of challenges to their inclusion efforts, our data show that most of these have maintained (62%) or actually increased (19%) their inclusion budgets amid these challenges2 — confirming their strong commitment to this work. In the few cases where budgets were reduced, companies noted that larger economic forces led to cuts across the business and were not specific to their inclusion or talent departments.
At the time of the survey, Champion companies told us that it is important not only to sustain but also to increase their momentum, especially through programs and initiatives that support employee resource groups and foster a sense of belonging through workplace inclusion. This shows that they are seeing benefits from current initiatives and are poised to advance them. They perceive these efforts as a fundamental element of their people strategy, and key to recruiting, developing, and retaining the talent necessary for business success.
This group knows that the benefits of tapping into the full spectrum and potential of talent haven’t changed — a view that many media headlines obscure. Indeed, 72% of C-suite and HR leaders plan to continue to build and enhance their current inclusion programs within the next two years.3 And employees are invested, too — demand for these programs from employees was up 9% since 2022, according to recent report from Edelman.4 Catalyst’s own research shows that 93% of employees think it’s important for their organization to be vocal about its inclusion efforts.5
Champion companies drive accountability through fair processes like pay equity
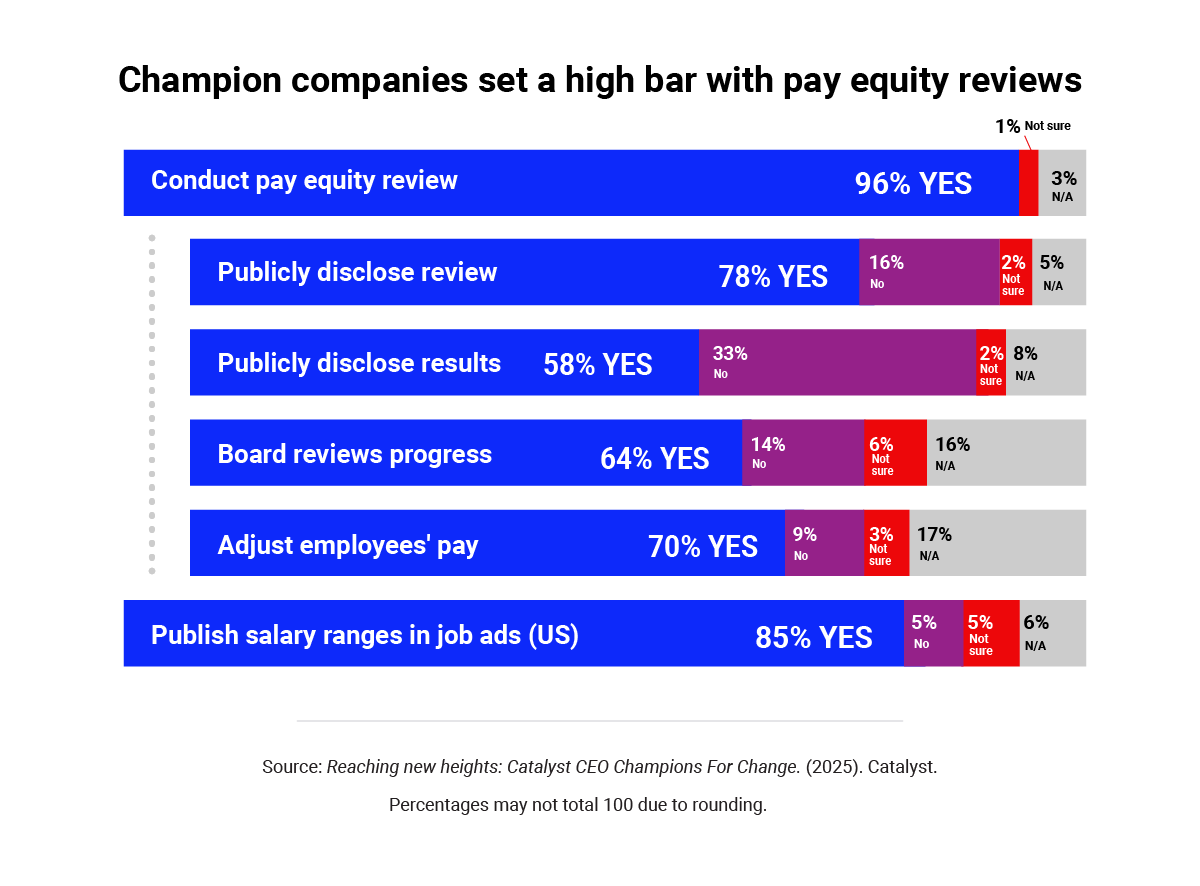
Around the world, men outearn women,6 with the size of the gender wage gap varying substantially by racial and ethnic group.7 Pay equity should be a top priority for all companies because pay gaps are evidence of systemic biases that can prevent all employees from thriving, yet only 62% of employers report that pay equity analyses are current or planned practices.8 Among Champion companies, however, we have seen major growth in pay equity efforts since we started tracking this issue two years ago. This year, we see that 96% — almost all — of Champion companies conduct pay equity audits, up from 93% last year and 82% the previous year. In comparison, only 70% of US companies conduct similar audits.9 Identifying and closing pay gaps is a concrete way Champion companies can hold themselves accountable for attracting and retaining the best talent and creating fairer workplaces — and it is impacting employees globally: Champion companies, collectively, conducted pay equity reviews in a total of 108 countries across the world..
Most (78%) conduct a pay equity review once per year, and in 70% of companies, employee pay is adjusted based on the results. In close to two-thirds of companies (64%), the board reviews progress, and 58% of companies share the results publicly. New this year, we find that in the US, 85% of companies are improving pay transparency by publishing salary ranges in job ads, including 41% that did so for jobs in states and cities that have not made pay range disclosure mandatory.
Clearly, Champion companies have made pay equity reviews a standard part of their accountability framework, using them to check — often publicly — that their pay practices reflect their commitment to fairness and transparency.
Champion companies are once again outpacing their peers, across every level
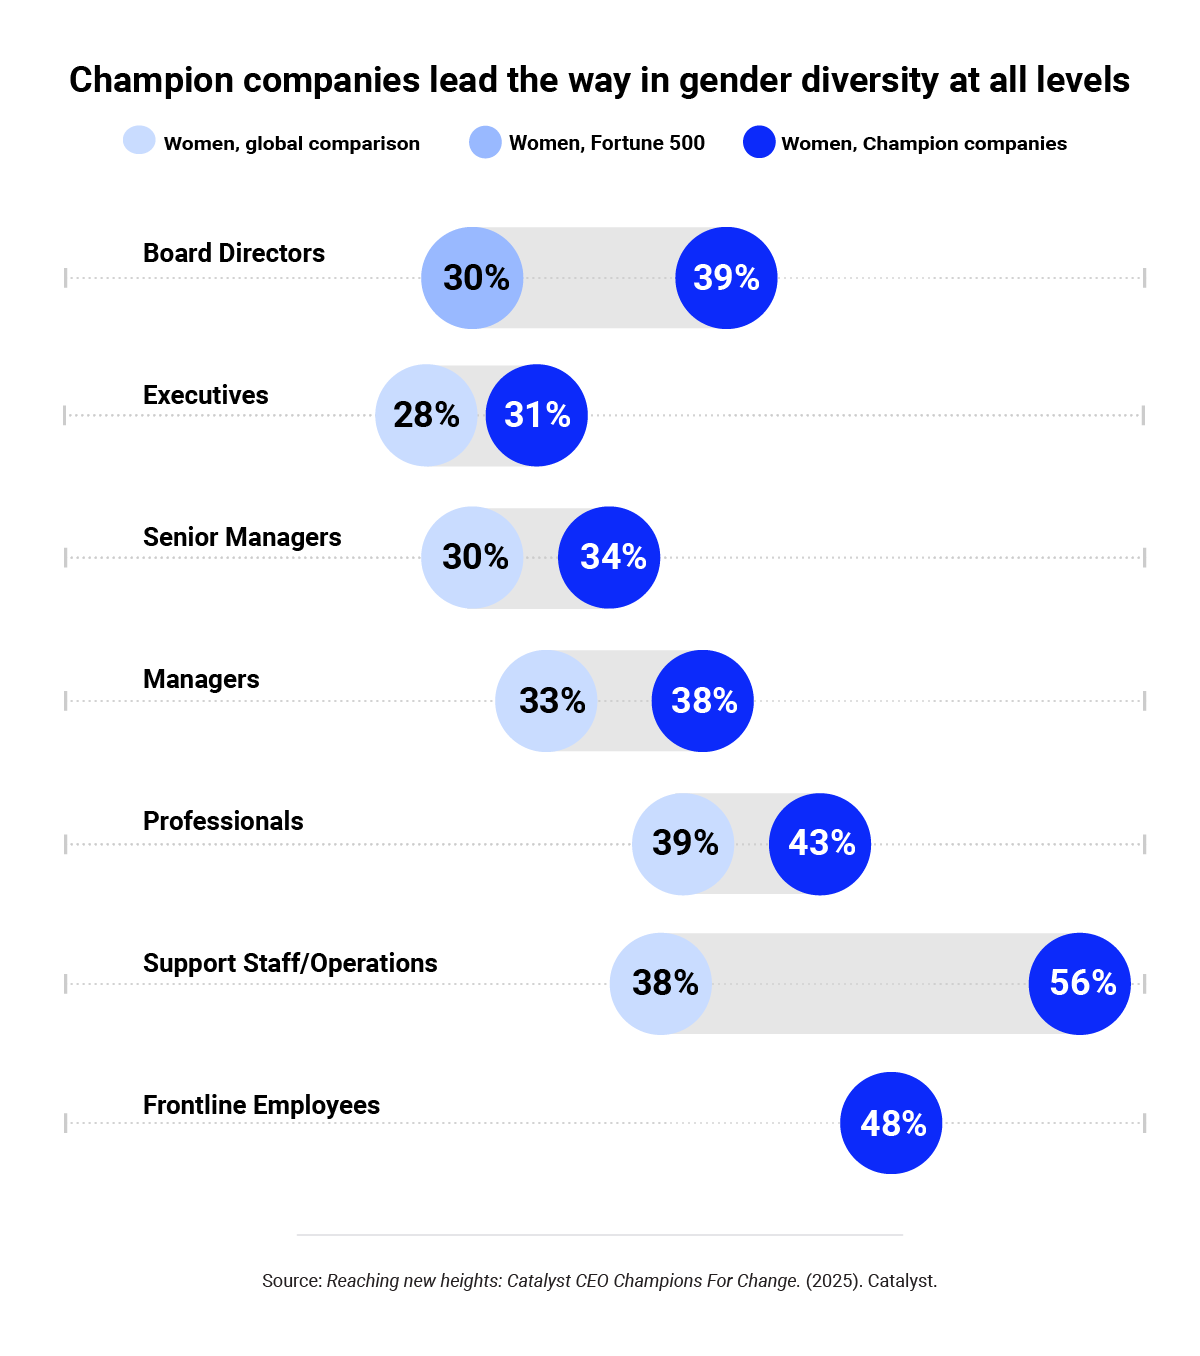
In every survey since 2017, Champions have outpaced our benchmark for gender diversity across all organizational levels, and this year is no different. This shows that they are truly committed to policies and practices to remove biases and artificial barriers, ensuring all deserving talent has the opportunity to rise and thrive through the organizational meritocracy.
Progress is especially noticeable on Boards of Directors, where 39% of Champion company Board seats are held by women, up 2% from last year, compared to 30% for the Fortune 500. For Champion companies, gender parity at the Board level is within close reach. At all other levels we see that Champion companies continue to make progress advancing women as compared to the global average.10
Champion companies retain employees across gender, but the manager level is tricky
Last year, we examined another critical indicator of organizational health in the Champions community: employee retention. Specifically, we aimed to understand whether these leading-edge organizations were retaining employees across gender, race, and ethnicity at equal rates. We found that Champion companies were successfully retaining women across all levels at similar, or, in some cases, slightly higher rates as men — and the same held true when comparing women and men from marginalized racial and ethnic groups.11
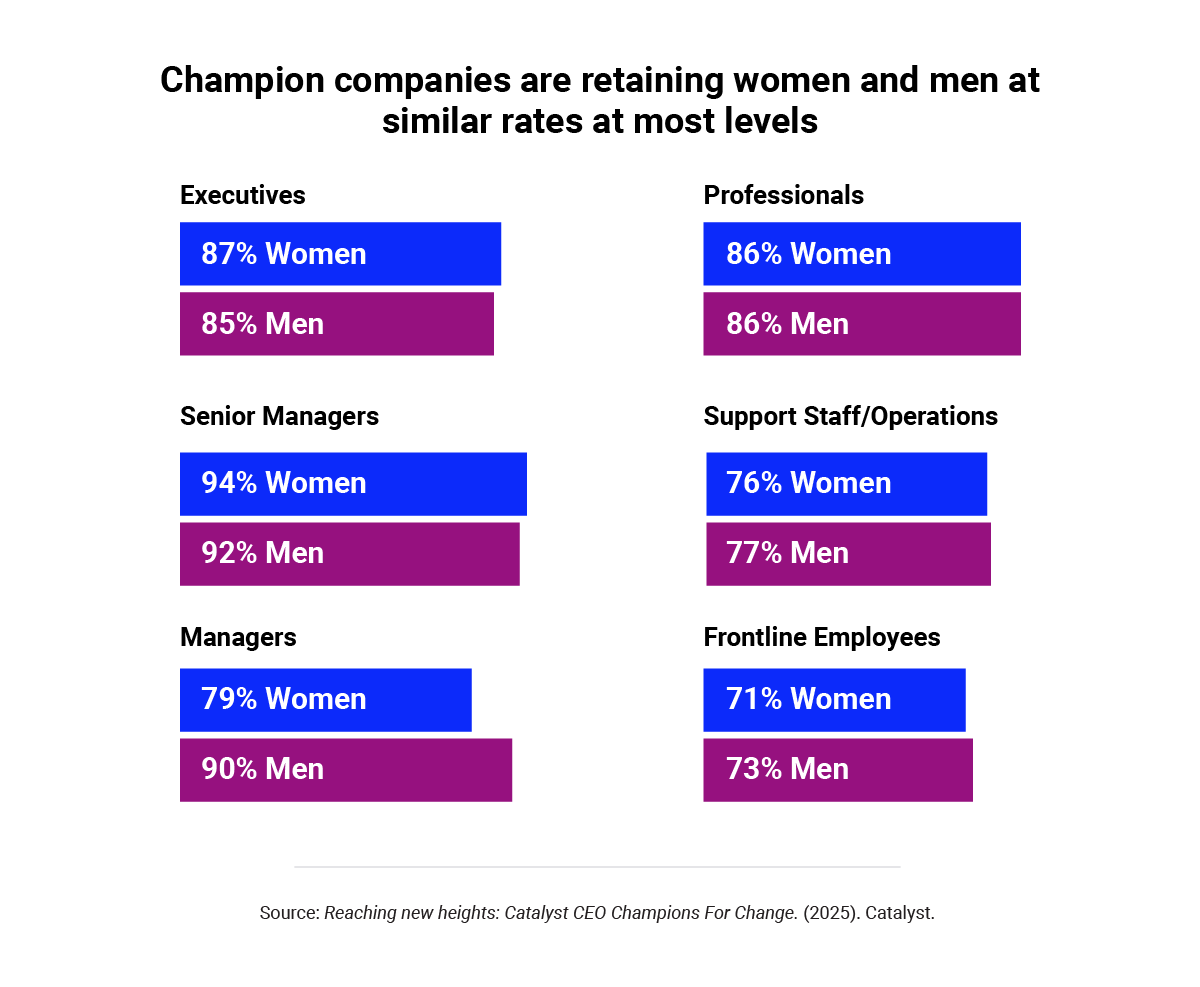
This year, according to a subset of participants who provided retention data, Champion companies are retaining employees of different genders at similar rates across most levels. The one exception, which differs from last year’s results, is at the manager level where fewer women (79%) than men (90%) are being retained. This is one area where all companies can pay attention, as women tend to face substantial barriers to career progression at this level, including biased performance reviews and disproportionately lower promotion rates compared to men, which could explain the retention gap.12 Attrition at this level not only hurts women’s careers but also hurts companies because it is expensive and disruptive to replace their valuable talent and experience.13
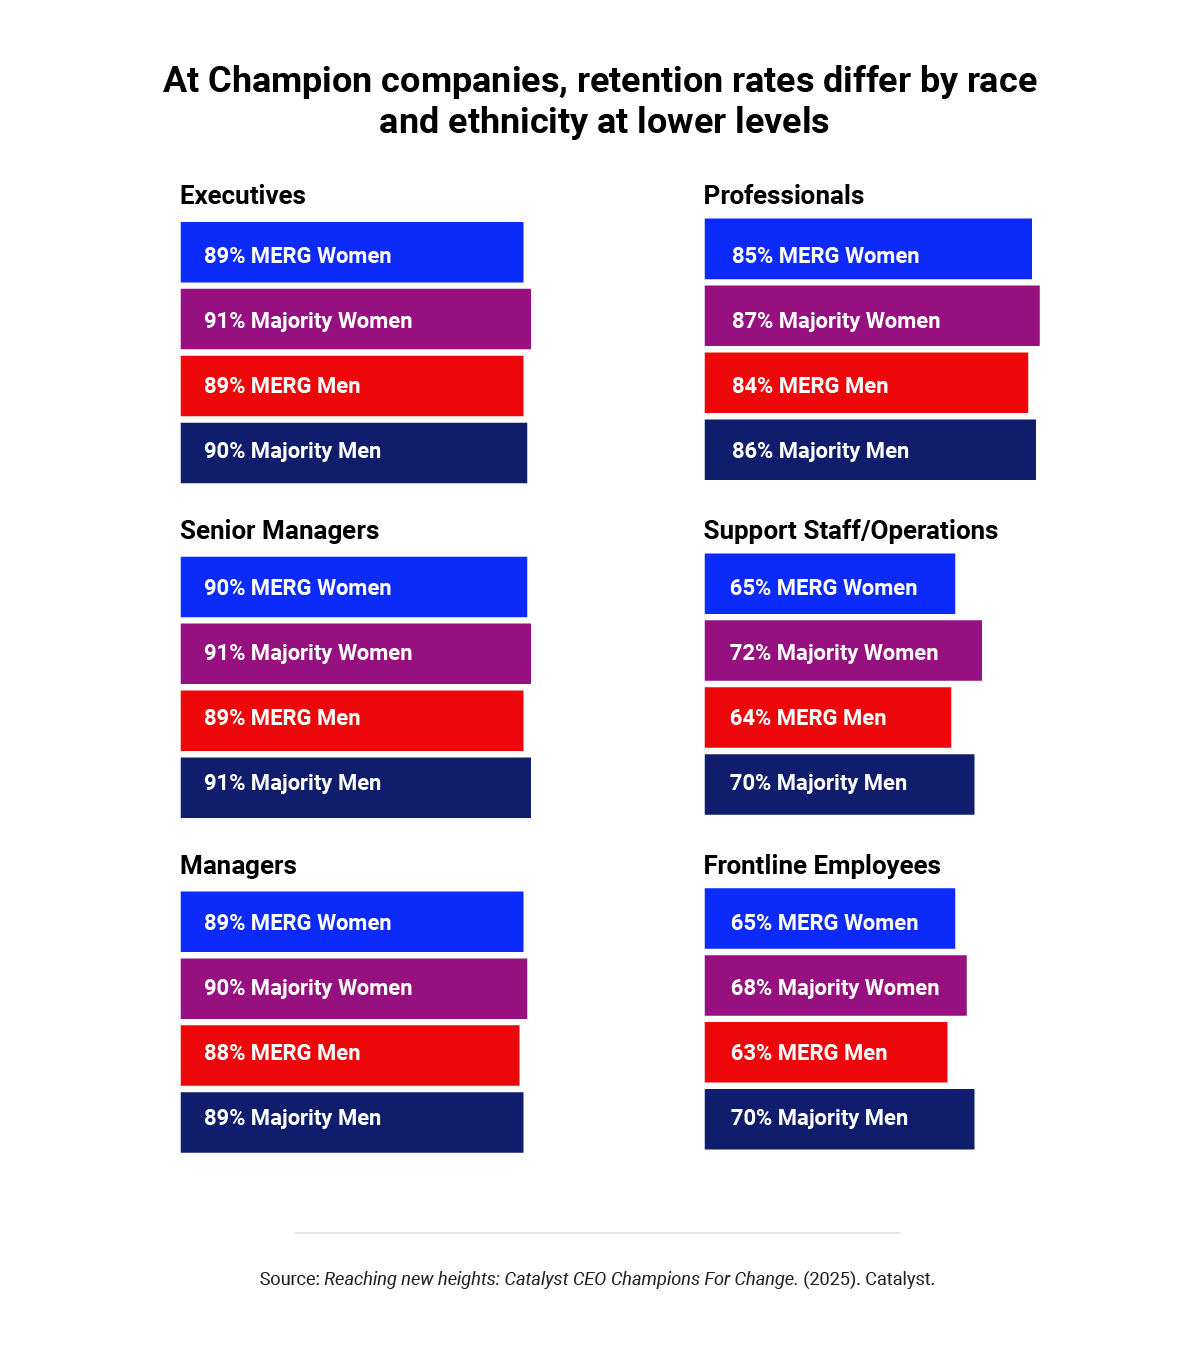
When we compare retention rates for White employees to those of peers from marginalized racial and ethnic groups at Champion companies across six selected countries, we see that they are similar in corporate settings. But for support staff and operations, and for employees in frontline roles, there are differences by race and ethnicity that need to be addressed: White employees are being retained at higher rates than employees from marginalized racial and ethnic groups. This finding presents an opportunity for Champion companies and the larger business community to zero in on the employee experience at these levels, using an intersectional lens that is sensitive to the many ways race and ethnicity affect employee engagement, development, and intent to stay — which are key to high-performing teams that drive business results.
Take action
As Champion companies demonstrate, making progress is about steadily pushing forward with determination and resolution, even in challenging circumstances. It might not be a smooth path, but firm leadership and persistence will enable advancement. To reach new heights in your organization, CEOs and other senior leaders can take the following steps:
1. Demonstrate that inclusion is core to your values and your business.
Why: Catalyst research shows that six actions have an outsized impact on whether employees perceive inclusion policies as genuine: communicating a fairness case, building accountability, acting with integrity, ensuring alignment, creating transparency, and preventing a climate of silence. When you know where your organization is on each of these factors, you can pinpoint actions to show that your initiatives are sincere.
How: Get clear on your organization’s values and how they are essential to your ability to win in the marketplace. Work with HR, Communications, and Business Lead Colleagues to connect the dots between your values and your talent and inclusion priorities, initiatives, and messaging.
- Read the report: Six Actions to Create Genuine DEI Policies
2. Integrate an inclusion lens into strategic decision-making.
Why: Conducting PESTLE (political, economic, social, technological, legal, and environmental) analyses with inclusion in mind can protect your company from going backward on the progress you’ve made while navigating an uncertain future.
How: As you forecast trends, challenges, and opportunities, make sure you are asking the right questions and not overlooking threats to the business or your talent initiatives by gathering a wide range of feedback from different perspectives. Follow up analyses with a robust measurement process and scenario planning to ensure inclusion-related efforts are tied to specific business outcomes.
- Read the tool: How to Embed DEI Into a PESTLE Analysis: Explainer
3. Sharpen your messaging on diversity and inclusion.
Why: Almost one-quarter (24%) of employees say that their senior leaders never or rarely talk about diversity.14 But how you talk about it matters: employees respond more favorably to the fairness case — that diversity is the right thing to do — than they do to the business case — that it’s the profitable thing to do.15 Refining your messaging can also make employees from marginalized groups less likely to be on guard to bias due to gender, race, ethnicity, sexual orientation, or disability.16
How: Review all the places your organization communicates about its culture change initiatives, such as the website, intranet, social media, and collateral, as well as talking points for senior leaders. Refresh your messages and rationales to align with organizational values, current initiatives, and what you know resonates with your employees.
Aim higher
A key reason Catalyst CEO Champion For Change companies are so successful in their inclusion initiatives is that, by definition, their CEOs are committed to and involved in them. When employees see senior leaders who are heartfelt and vocal about their values and vision, they know that programs and practices are put in place because of true commitment, and not just for appearances or to check a box. Passionate leaders generate passionate employees, and when people are working together toward a shared goal, there is no limit to how high they can go.
Methodology
These findings are based on responses to a survey distributed to all Catalyst CEO Champions For Change companies that were eligible to submit. Sixty-seven companies responded to the survey and self-reported employee demographic data for their 2023 fiscal year. The survey findings are reported in aggregate to protect the anonymity of the respondents and the confidentiality of their data.
Budgetary allocation and free-response questions:
All participants were asked the following question: “In light of recent challenges faced by DEI initiatives, how has your organization adjusted its budgetary allocations to manage these issues?” Following their selection, participants were asked to expand on their selection by describing the factors that contributed to their decision. Additionally, we asked participants to share examples of 1-3 diversity and inclusion priorities that are energizing them for the coming year. These responses were analyzed using the qualitative data analysis software NVIVO. The Catalyst CEO Champions For Change team then analyzed each response by theme. Analyses revealed themes that were summarized for this report.
Pay equity:
Often referred to as “equal pay for equal work,” pay equity is the practice of paying people the same for doing the same or similar work, while accounting for non-discriminatory factors like location. Companies can work toward pay equity in their organizations by conducting close examinations of their workforce and compensation data and implementing accountability mechanisms.17 All survey participants were asked the following question: “Has your organization conducted a pay equity review in the last 3 years?” The 64 participants who responded “yes” were subsequently asked a series of additional questions, including:
- Which of the following statements reflect the reporting or disclosure requirements for the location(s) in which your organization conducted a pay equity review? Select all that apply.18
- In which countries did you conduct pay equity review?
- Has your organization publicly disclosed that it has undertaken a pay equity review?
- Has your organization publicly disclosed the results of a pay equity review?19
- Does your organization conduct a pay equity review annually?
- Does your organization’s board of directors (or equivalent) review pay equity progress/findings?
- Has your organization adjusted employees’ pay following a pay equity review?
Additionally, all participants were asked the following question: “In the US, did your organization publish salary ranges in job advertisements during your 2023 fiscal year?” The participants who responded “yes” were subsequently asked, “Which of the following statements reflect the disclosure requirements for the location(s) in which your organization published salary ranges? Select all that apply."20
Representation and retention:
Representation and retention were calculated in aggregate, combining workforce data from all participating companies to assess collective progress.
- Representation was determined by dividing the number of Catalyst CEO Champions For Change employee positions at a given job level held by a given identity group by the total number of Catalyst CEO Champions For Change employee positions at that same level. Representation figures were disaggregated globally by gender, while a smaller sample across six countries (Australia, Brazil, Canada, South Africa, the United Kingdom, and the United States) was used to disaggregate representation by gender, race, and ethnicity, with most responses coming from the United States. For boards of directors (or equivalent), representation of women, including women from marginalized racial and ethnic groups, reflects primarily global boards.
- Retention rates were determined by dividing the number of Catalyst CEO Champions For Change employees at a given job level who were retained by their employer for the entire fiscal year by the total number of Catalyst CEO Champions For Change employees at that same level at the beginning of the fiscal year. For the purposes of this survey, job level calculations were based on an employee’s position at the beginning of the fiscal year and did not incorporate promotions between job levels. Retention rates were disaggregated globally by gender, while a smaller sample across six countries (Australia, Brazil, Canada, South Africa, the United Kingdom, and the United States) was used to disaggregate retention rates by gender, race, and ethnicity, with most responses coming from the United States. Forty-three companies provided global retention data by gender (including 31 that provided data for frontline employees), and 42 companies contributed retention data by gender, race, and ethnicity in at least one of the six selected countries (including 30 that contributed data for frontline employees).
To provide consistent measurements of race and ethnicity, participants were asked to provide data on employees from marginalized racial and ethnic groups, defined as groups of people who experience disproportionate systemic oppression, discrimination, and lack of societal resources, privileges, and power based on their racial or ethnic identities.21 Majority groups are defined as groups of people that “possess a disproportionate share of societal resources, privileges, and power.”22 Employees who identified with more than one race or ethnicity (i.e., multiracial or multiethnic employees) were included among the counts of people from marginalized racial and ethnic groups, even if one of the groups with which they identified was the majority group.
The survey included three options for gender: women, men, nonbinary/unknown gender identity. We do not provide results for nonbinary/unknown gender identity due to low sample size.
Job levels:
Participants were provided with six job level bands, with definitions and examples across industries. Catalyst’s findings for women’s global workforce representation among Champion companies in bands 1-5 were compared against women’s global representation among the weighted results from the 1,708 participating organizations in Mercer’s Total Remuneration Survey and Comptryx databases.
-
Band 1 – Executives: “Individuals who plan, direct and formulate policies, set strategy and provide the overall direction of the enterprise/organization. Residing in the highest levels of the organization, these executives plan, direct or coordinate activities with the support of subordinate executives and staff managers. Likely to include those individuals within two reporting levels of the CEO, whose responsibilities require frequent interaction with the CEO. In smaller organizations, this may include the CEO and his/her direct reports only.”23
-
Band 2 – Senior Managers: “Includes employees who determine policy and direction of the organization or a functional area and direct its activities, usually through other managers. They control the selection of senior employees and the allocation of resources.”24
-
Band 3 – Managers: “Includes employees who coordinate and organize the activities of a discrete unit or service within the organization, usually reporting to a senior manager. They establish operational and administrative procedures, formulate policy relevant to their areas, and organize, lead and direct others to achieve their goals. Likely includes first- to mid-level managers.”25
-
Band 4 – Professionals: “Most occupations in this group are responsible for professional and technical day-to-day activities of the division/company. In some instances, relevant experience is required in addition to more formal qualifications. Senior positions may take team leader roles designed around specialist expertise rather than people management. Can include sales professionals.”26
-
Band 5 – Support Staff/Operations: “Individual contributors that provide organizational-related support or service. Includes roles with non-managerial tasks such as administrative, clerical, operational support and technicians – excluding frontline employees. Includes employees who perform operational tasks according to specific standards and guidelines. Most occupations in this group require only limited job knowledge or relevant experience.”27
-
Band 6 – Frontline Employees: Someone working in a job directly involved in production, processing, and service delivery in a non-office setting that typically does not require higher-education qualifications. Catalyst research at this time focuses on those required to work in-person at a specific physical location (e.g., factory, hotel, restaurant, store) during shifts that may be set or variable and often include hours outside the current Monday to Friday, 9-to-5 paradigm of office work. Some examples are production line (shop floor) employees in manufacturing; cooks and kitchen staff in food services; or housekeeping staff in hospitality; sales workers; laborers and helpers; operatives; craft workers; and service workers.28 A subset of respondents (47 companies) provided data on frontline employees.
-
Board of directors include executive committee members in law firms for the purposes of this survey. Survey participants were asked to report data for all members of their board of directors, which may span multiple countries/markets.
The survey findings for boards of directors were compared against the representation of women, and specifically women from marginalized racial and ethnic groups, among boards of directors in the Fortune 500.29 These findings were not compared to the S&P 500 due to lack of reliable data on women from marginalized racial and ethnic groups.
The findings of this year’s Catalyst CEO Champions For Change survey are not comparable to findings from surveys of previous years.30 The total number of companies participating in the survey has changed each year since the start of the initiative in 2017. The 2019 survey examined increases in women’s representation across leadership roles over a five-year period, drawing from the 2019 pool of surveyed companies, while the 2021 survey measured promotions in addition to representation. Pay equity was first measured in the 2022 survey, which also gathered qualitative data about the role of the board of directors in governing and impacting an organization’s diversity, and inclusion initiatives. Additionally, starting in 2018 each survey has measured the representation of women across the leadership pipeline in the global workforce, while the 2017 survey examined women across the leadership pipeline in the United States workforce only. All eight surveys assessed the representation of women of color in the United States; however, findings are not comparable across years because the definitions of job categories for this group changed in 2020 and the number of companies participating in the survey increased each year. The 2024 and 2023 surveys measured retention across gender, racial and ethnic groups, and job levels. Finally, in 2023 we began including demographics for employees across all levels of the workforce, including levels below management.
Endnotes
- Catalyst analysis of Catalyst CEO Champions For Change companies.
- Responses were collected from June-August 2024. This analysis does not include the 12% of Champion company respondents who indicated that they did not experience any significant challenges with their inclusion initiatives.
- 2024 inclusion barometer. (2024). Bridge Partners; McGlauflin, P. & Burleigh, E. (2024). The vast majority of C-suite leaders say they’re doubling down on DEI, but they’re still fighting an uphill battle. Fortune.
- 2024 Edelman trust barometer: Special report: Business & racial justice. (2024). Edelman.
- Shaffer, E. & Torrez, B. (2024). How to talk about diversity with employees to achieve your company’s objectives. Catalyst.
- Women earn approximately 77 cents for every $1USD earned by men, globally. In OECD countries, the average gender pay gap is 11%. International equal pay day: 18 September. (n.d.). United Nations; Gender wage gap. (n.d.). OECD.
- Javaid, S. (2024). The wage gap robs women working full time, year-round of hundreds of thousands of dollars over a lifetime. National Women’s Law Center.
- 2024 compensation best practices report. (2024). Payscale.
- Donovan, J. (2024, March 11). How organizations can take a systematic approach to pay equity. SHRM.
- Among Catalyst CEO Champions For Change organizations, women of marginalized racial and ethnic groups represented 8% of executives, 11% of senior managers, 15% of managers, 18% of professionals, 28% of support staff/operations, and 27% of frontline employees. This represents a subset of workforce data from Australia, Brazil, Canada, South Africa, the United Kingdom, and the United States, with the majority of responses coming from the US. Women of marginalized racial and ethnic groups made up 10% of board directors, outpacing the Fortune 500 (8%). Missing pieces report: A board diversity census of women and underrepresented racial and ethnic groups on Fortune 500 boards, 7th edition. (2023). Alliance for Board Diversity and Deloitte.
- This CEO community is keeping and advancing their best talent. Are you? (2024). Catalyst.
- Women in the workplace 2024: The 10th anniversary report. (2024). Lean In and McKinsey & Company; Women in the workplace 2023. (2023). Lean In and McKinsey & Company.
- Are your employees thriving, or just surviving? Here’s what’s missing. (2023). Harvard Business Review and Workhuman.
- Shaffer & Torrez (2024).
- Shaffer & Torrez (2024).
- Shaffer & Torrez (2024).
- Getting started with pay equity (Practices). (2022). Catalyst; Nagele-Piazza, L. (2020). The importance of pay equity. Society for Human Resource Management.
- Answer options were: “My organization conducted a pay equity review in compliance with a local law requiring reporting or disclosure of pay information,” “My organization conducted a pay equity review in a geography that does not have reporting or disclosure requirements for pay information,” and “I am not sure about the reporting or disclosure requirements for pay information in the location(s) in which my organization conducted a pay equity review.”
- If yes, responses were prompted to indicate the type(s) of results they disclosed.
- Answer options were: “My organization published salary ranges in compliance with a local state or city law requiring disclosure of pay information to job candidates,” “My organization published salary ranges in a state or city that does not have laws mandating disclosure of pay information to job candidates,” and “I am not sure about the laws for disclosing pay information to job candidates in the location(s) in which my organization published salary ranges.”
- Ramos, C. & Brassel, S. (2020). Intersectionality: When identities converge. Catalyst; Knowles, E.D. & Peng, K. (2005). White selves: Conceptualizing and measuring a dominant-group identity. Journal of Personality and Social Psychology, 89(2), 223-241.
- Knowles & Peng (2005).
- Career level definition is based upon Mercer’s Global Internal Labor Market (ILM) Map data.
- Career level definition is based upon Mercer’s Global Internal Labor Market (ILM) Map data.
- Career level definition is based upon Mercer’s Global Internal Labor Market (ILM) Map data.
- Career level definition is based upon Mercer’s Global Internal Labor Market (ILM) Map data.
- Career level definition is based upon Mercer’s Global Internal Labor Market (ILM) Map data. Mercer also uses the term Para-professional for this category.
- Catalyst’s definition of frontline employees.
- Missing pieces report: A board diversity census of women and underrepresented racial and ethnic groups on Fortune 500 boards, 7th edition. (2023). Alliance for Board Diversity and Deloitte.
- This CEO community is keeping and advancing their best talent. Are you? (2024). Catalyst; Aligning actions to values: The Catalyst CEO Champions For Change. (2022). Catalyst; Prioritizing equity at a pivotal moment: The Catalyst CEO Champions For Change. (2021). Catalyst; Towards a more equitable future: The Catalyst CEO Champions For Change. (2020). Catalyst.; Progress in action: Catalyst CEO Champions For Change. (2019). Catalyst; Inclusion in action: The Catalyst CEO Champions For Change. (2018). Catalyst; Everyday heroes: Catalyst CEO Champions For Change. (2017). Catalyst.