A Different Perspective
For most people, trust is essential to productive work relationships. Most people also tend to view trust from the angle of the person granting the trust—the person who says, “I trust you.”1 In the workplace, it’s often the manager or leader, who “has trust” in their direct reports and other employees to get the job done.
But what if we looked at trust from the opposite direction? What does trust look like for the person in whom the trust is placed? What does the experience of being trusted feel like? From this perspective, the recipient of trust decides whether or not trust exists—and if they can truly state, “I am trusted by you.” For employees, this decision typically is based on the actions of the manager or colleague granting the trust.
For example, imagine your manager, Fiona, asks you to write a report for a client based on data you and other colleagues have gathered. Fiona solicits your ideas on how to structure the report and gives you high-level guidance. Then, she provides space for you to draft the report and ask her or teammates follow-up questions as necessary. When you show her drafts, she provides feedback with ideas on how to strengthen it; throughout the process, she includes you on calls with the client when the report is being discussed.
Now imagine you get the same project from a different manager, Helen. This manager says she trusts you to do a great job, but she frequently checks in with you to deliver detailed instructions for how to organise the report, what to include, and what data points to use. When you share drafts, you find that she has rewritten whole sections herself. And she never invites you to calls with the client.
Fiona’s actions convey that you are viewed as a valuable member of the team who can deliver results, contribute to organisational goals, and participate in the decision-making process. Helen’s actions may signal that she’s unsure about your ability to successfully complete the report and doesn’t value your input.
Whom would you rather work for?
Trust is more than a positive feeling: It’s an action employees experience in their daily interactions with managers and team members.


Prior Catalyst research shows that the experience of being trusted is one of five defining features of an inclusive work environment2—so it’s important to understand just how employees feel about their opportunities to contribute to organisational goals and participate in the decision-making process.
In this report, we’ll do just that by exploring how:
- Employees working in five countries in Europe experience trust.
- Trust functions as a key link between team cohesion and employee- and team-level outcomes.
- Managers can build teams with more trust and, by extension, more inclusion, where everyone can belong, contribute, and thrive.
Key Findings
- Only 46% of employees report often or always being trusted at work.
- Women (43%) experience less trust at their organisations than do men (49%).
- Trust helps employees innovate and feel engaged: The experience of being trusted significantly predicts employee innovation and employee engagement.
- Trust brings out the best in employee teams: The experience of being trusted significantly predicts team innovation, team citizenship, and team problem-solving.
- Leaders and organisational systems have a significant impact on employee experiences of trust. Inclusive leaders, fair policies and procedures, and a supportive workplace environment all increase the experience of trust.
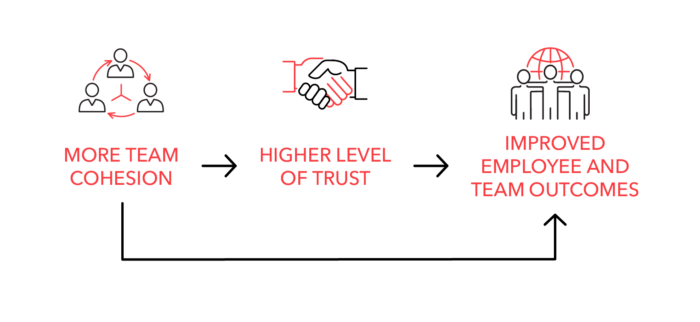
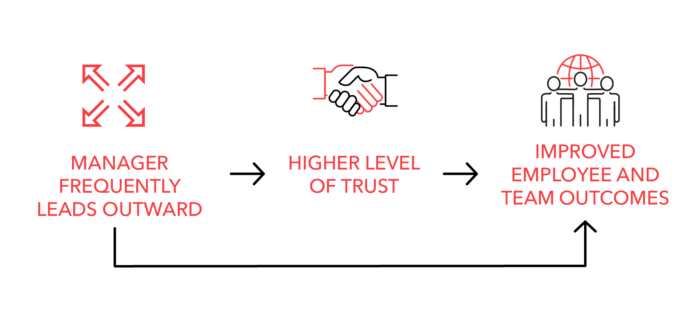
- As teams become more cohesive, and as leaders become more inclusive, employees experience higher levels of trust. As a result:
- Employees are more engaged in their work and innovative.
- Teams are better at solving problems, being innovative, and demonstrating citizenship.
Inclusive leaders, fair policies and procedures, and a supportive workplace environment all increase the experience of trust.
About the Sample
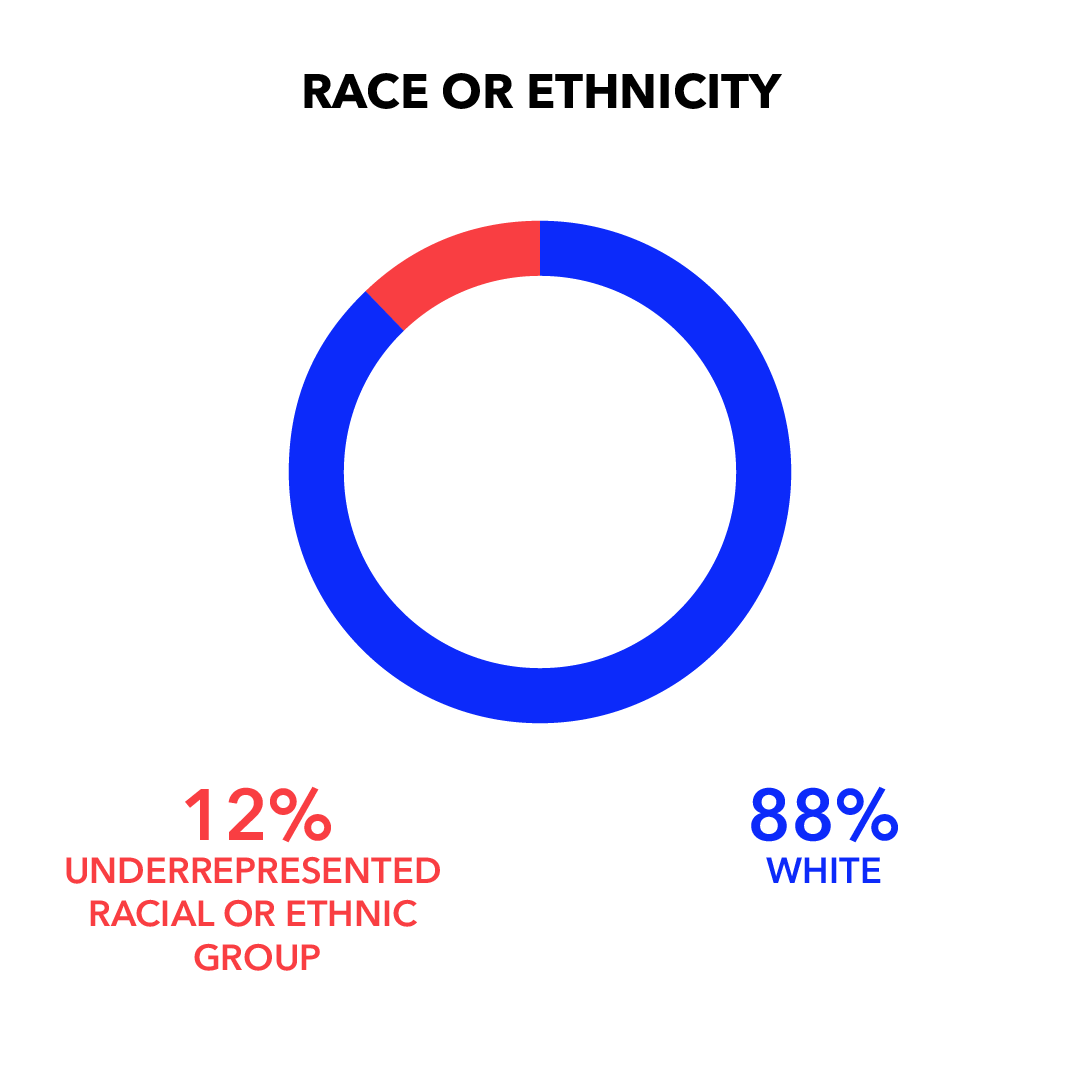
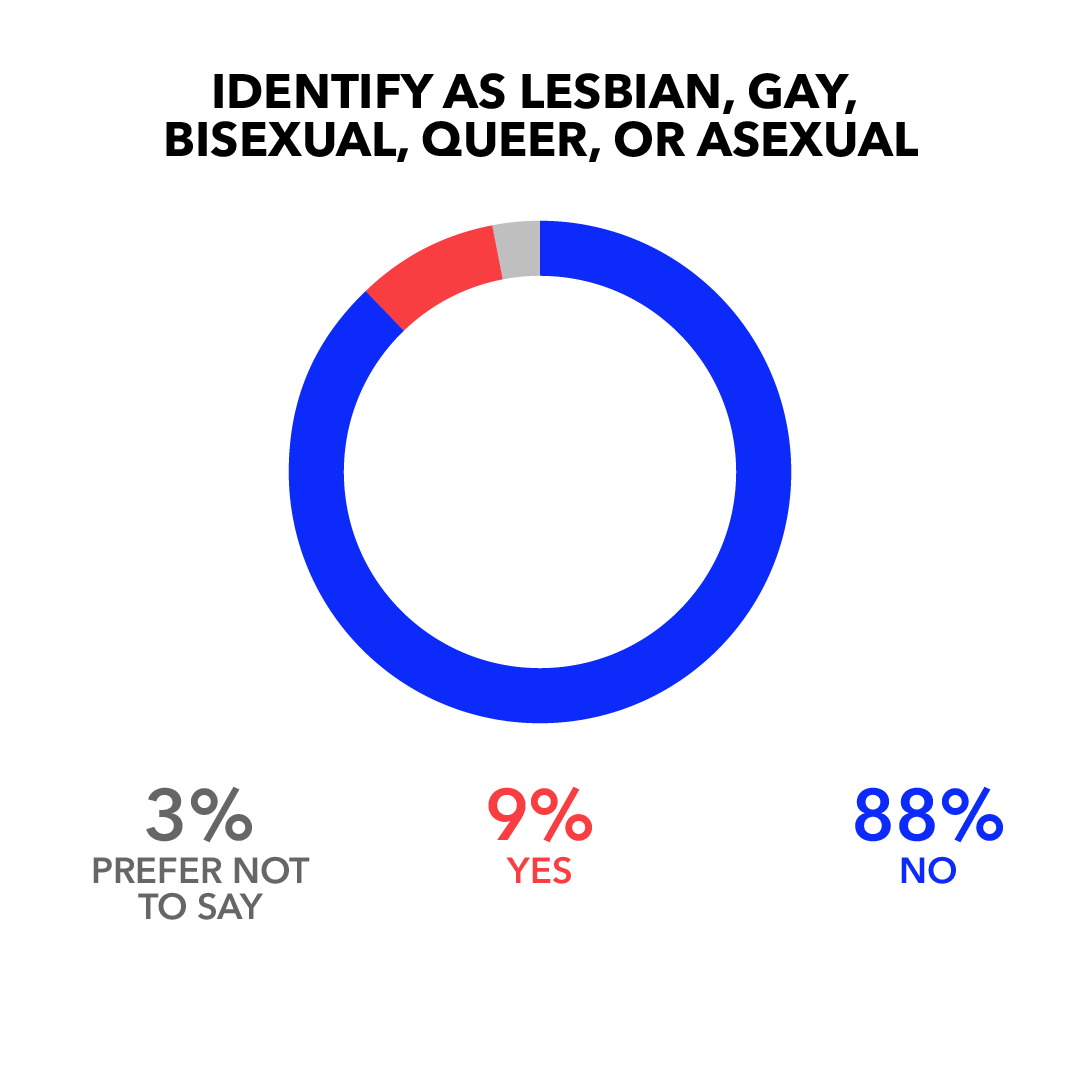
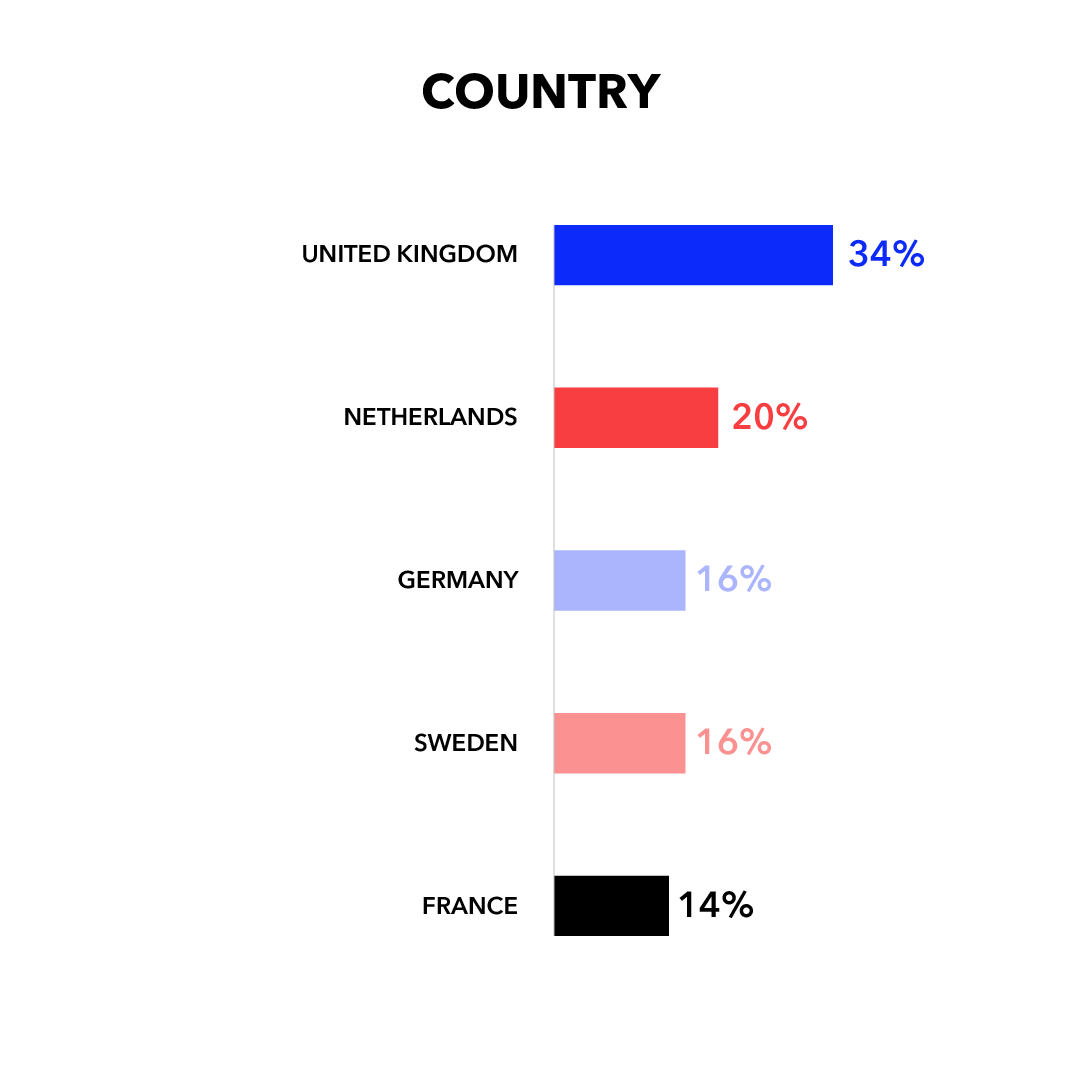
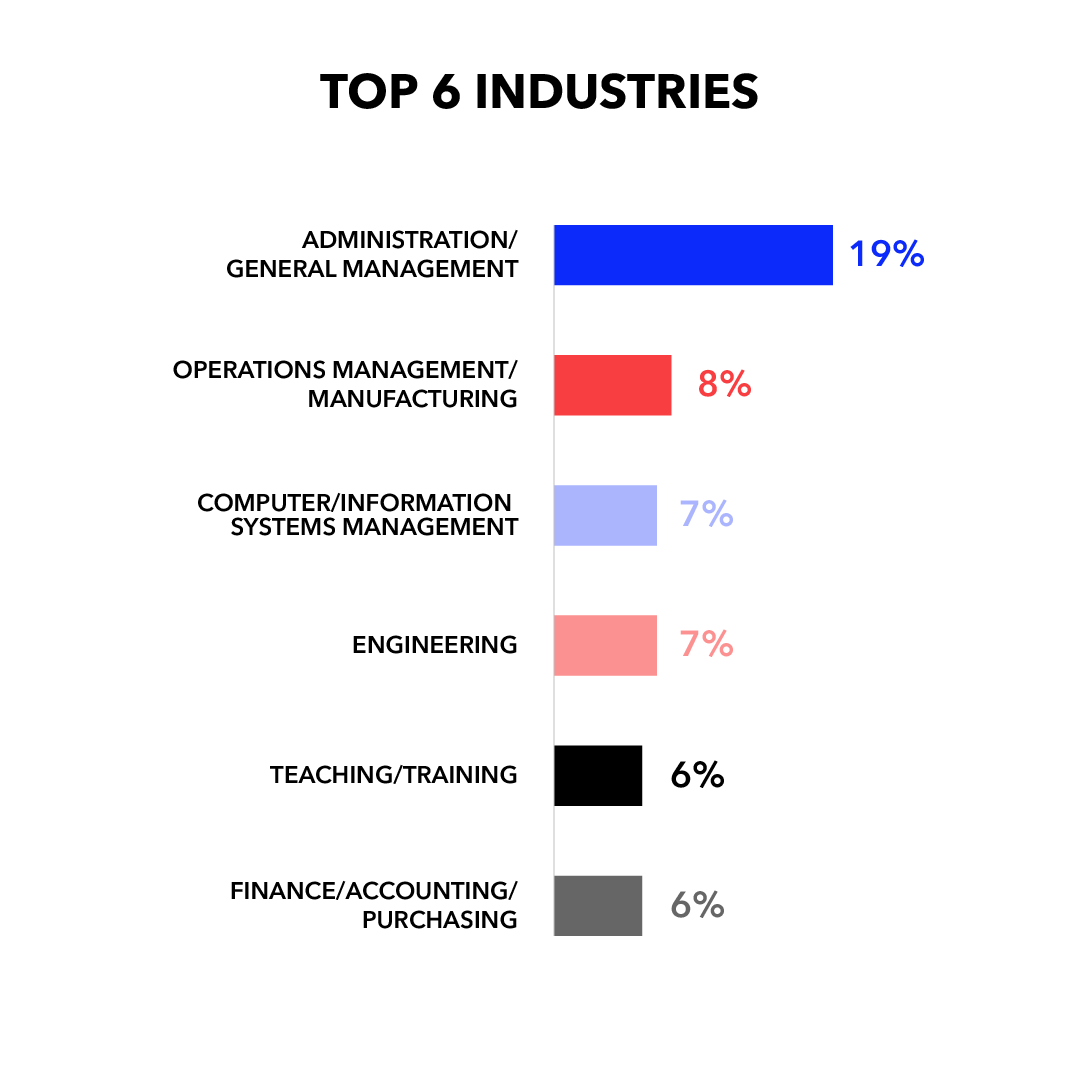
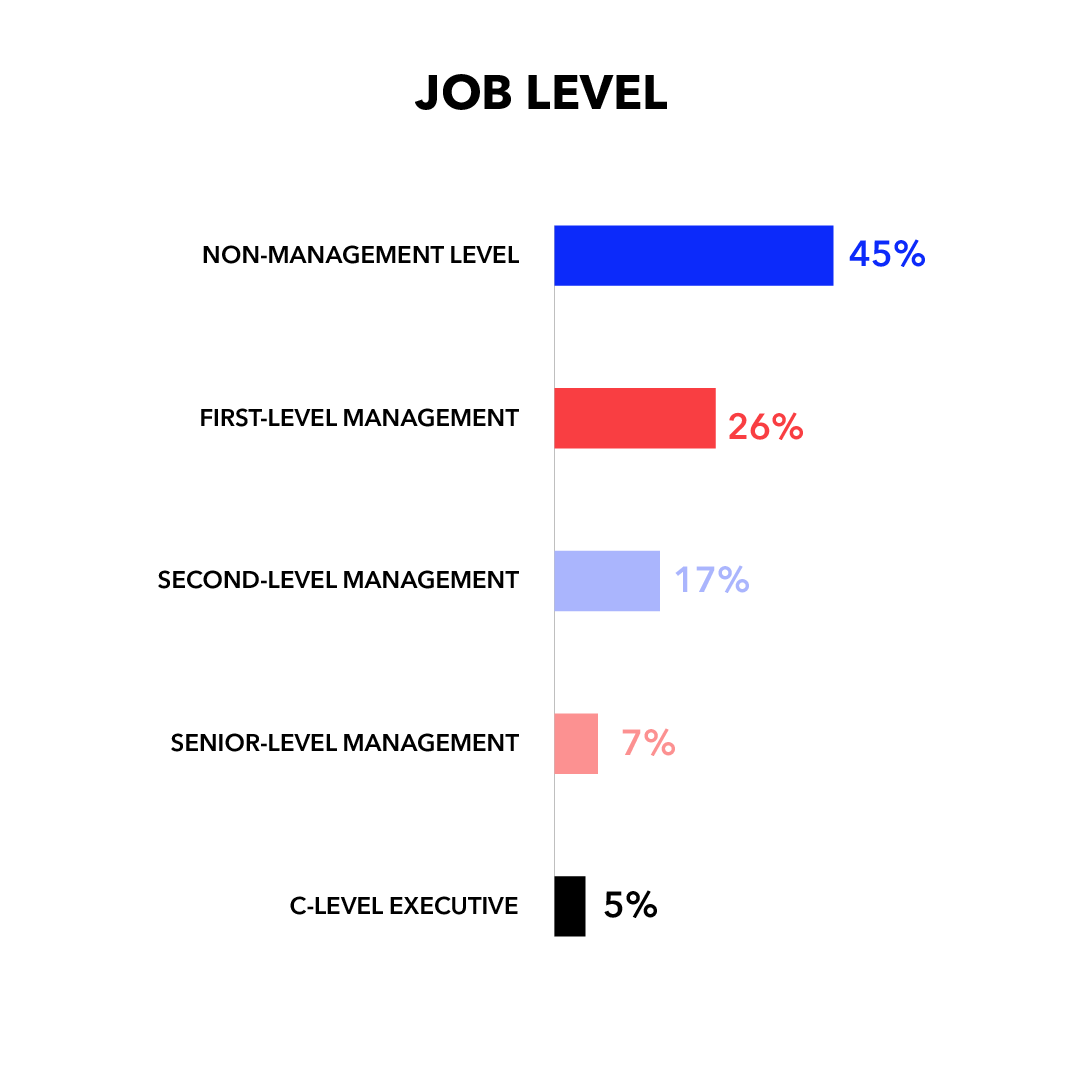
We surveyed 1,737 full-time employees in five countries in Europe—the United Kingdom, Netherlands, Germany, Sweden, and France. Participants were employed in a wide range of functions, industries, and ranks within their organisations.

What Is Trust?
To better understand trust from the employee point of view, we asked survey respondents several questions about different aspects of trust and how often they experience them.
According to their responses, the most critical features of being trusted were having opportunities to contribute to organisational goals and being invited by colleagues to participate in decision-making.4
These findings are consistent with other research that has identified trust (particularly the experience of being involved in decision-making processes) as a key factor in the experience of inclusion.5
Trust at Work: A Definition
You make meaningful contributions and are influential in decision-making.3
Who Experiences Trust?
Engaging employees who feel removed from the inner workings of their organisations and who don’t feel they play a vital role in their organisations is one of the most significant challenges for employers.6 This experience of exclusion isn’t unique to one place or country, but instead impacts employees around the world.7
In Europe, recent research8 has found that 84% of employees identified “being trusted by colleagues, coworkers, clients, and supervisors” as important to their happiness and motivation at work. Eighty-one percent of these employees also said that seeing a purpose in what they do was a critical factor in their satisfaction at work. Being trusted and able to contribute and see an impact of their work on organisational goals, it seems, are top-of-mind for employees and can make or break their experience at work.
Yet our research reveals that fewer than half of employees feel they are trusted at work. We also find a significant difference between women and men, as well as between those in non-management and management positions.
- Only 46% of employees report being trusted often or always at work. It should be concerning to leaders at all levels that more than half of employees do not feel a sense of trust at work.
- 43% of women compared to 49% of men say they often or always experience being trusted at work.9
- 36% of employees in non-management positions compared to 54% of those in management positions report that they often or always experience being trusted at work.10
Percentage of Employees Indicating Often or Always Experiencing Trust at Work


Why Does Trust Matter?
We found that the experience of being trusted at work significantly predicts important outcomes for employees and for how teams function.
- As trust increases, so does:
Coupled with employees’ overall experience of trust, these findings reveal a deep divide between the degree to which employees actually feel trusted and the clear, positive links between being trusted and key employee and organisational outcomes. By failing to foster a sense of trust, many employers are missing out on potential contributions of their employees and related team outcomes.
Benefits to Employees
- Employee Innovation: You think innovatively about new ideas, processes, products, or problem-solving approaches.
- Employee Engagement: You are emotionally committed and invested in the company’s mission and take pride in your work.
Benefits to Teams
- Team Innovation: Collectively, the team is able to generate creative solutions for the development of new products or ways of doing work better.
- Team Citizenship: Collectively, the team goes beyond what is typically expected to meet group objectives.
- Team Problem-Solving: The team is able to work together constructively, to find solutions to problems, and resolve conflict.
How Do Leaders Establish Trust?
Catalyst’s inclusive leadership framework16 featuring leading outward and leading inward behaviours offers insight into how leaders and managers can create inclusive workplaces. Leading outward focuses on accountability, ownership, and allyship, while leading inward is about courage, curiosity, and humility.
In this study, we learned that both facets of inclusive leadership had a significant impact on employees’ experience of trust17—but leading outward was much more influential than leading inward.18 Indeed, employee experiences of trust more than double when they perceive that their manager often or always leads outward.
Leading Outward
Your ability to bolster team members’ capacity to be empowered, treated fairly, and flourish at work.
Leading Inward
Your ability to act courageously, learn, and self-reflect.
- 81% of employees report experiencing a high level of trust when their manager frequently leads outward, but only 37% feel the same level of trust when their manager doesn’t frequently lead outward.19

It makes sense that leading outward—which is marked by a manager’s ability to create an environment where employees can work autonomously, hold employees accountable for their performance, and demonstrate visible allyship—would be more important to trust than leading inward, which is more focused on a manager’s inner attitudes.
Indeed, these findings echo research20 that has investigated how leaders and organisations can affect a major component of trust—participation in decision-making.21
Which Organisational Factors Affect Trust?
But employee experiences of trust are not solely influenced by manager behaviour. Employees also experience trust through wider, system-level factors, such as connections with colleagues, perceptions of procedural fairness, and team cohesion.
We found that all three of these factors have a significant, positive impact on employees’ experience of trust.22
Of the three, team cohesion—when team members feel connected and as though they are working toward a common goal—is most influential on employees’ experience of trust.23
The experience of being trusted almost triples when an employee’s team is more cohesive.
- 72% of employees report experiencing a high level of trust when their team is more cohesive, but only 25% of employees experience the same level of trust when their team is less cohesive.24

The Big Picture: Trust Unites Us
Our data show that trust is critical to business outcomes. Leaders, teams, and organisations that want to promote trust among employees should focus on team cohesion and leading outward for the greatest effect. Here’s how:
- As teams become more cohesive, employees experience higher levels of trust, and as a result:
- Similarly, the more a leader leads outward by holding employees accountable, acting as a visible ally, and fostering employee ownership over their work, the more trust employees experience. As a result:
Trust is a hallmark of inclusive workplaces, and when leaders and teams facilitate that trust, employees are not the only ones who benefit. In particular, the three leading outward behaviours of accountability, ownership, and allyship29 can guide leaders and organisations with specific actions that will help promote feelings of trust in their employees.

Actions Leaders Can Take
Accountability
- Provide constructive, real-time feedback, and hold employees accountable for improvement. Setting high expectations for improvement lets employees know that you trust that they can achieve their goals. Similarly, giving consistent and ongoing feedback on what has been done well and where there may be opportunity for improvement gives employees concrete information about how they can course-correct to contribute and better fulfill organisational goals. Don’t wait for annual review time to share what employees could have done differently.
Ownership
- Give employees and team members autonomy to perform their jobs well and achieve their goals. Leaders who set the tone for and clearly give latitude to their teams signal to employees that they have faith in the ability of the team, and individuals, to get the job done. For example, after a meeting, check in with your employees to see if they have any questions, and make sure they have what they need to successfully complete assignments.
- Avoid micromanaging. “Hovering” virtually or literally over an employee, frequently checking their actions or words, or telling them exactly what to do and how to do it communicates to employees that you don’t think they can do the job. Instead, schedule regular check-ins to get updates and provide big-picture guidance.
Allyship
- Advocate for employees who belong to marginalised groups. Besides championing individuals, make sure to embrace systemic changes, such as diversity, equity, and inclusion initiatives. Leaders who are visible allies and advocates show that all employees’ contributions are valued and create space for employees to feel they can contribute fully. In meetings, track whose voices are being heard and whose aren’t. Seek out the opinions and feedback of those whose voices may be stifled in meetings.
- Create opportunities for team members to discuss topics that may not directly relate to their work or projects. For example, set aside time for courageous conversations, or hold team lunches—even if they are conducted virtually. These conversations can help team members get to know one another, build team relationships, share life experiences and perspectives, and address tough issues.

Actions Organisations Can Take
Accountability
- Make sure organisational goals are clear and communicated transparently to employees. For a team to work together cohesively, team members need line of sight to the purpose of their work and what they’re striving for. If information on new organisational policies or goals is shared, encourage managers to check in with their employees to see if they have any questions or concerns.
Ownership
- Make organisational decisions in a transparent manner. It’s also important to create space for employees to voice their thoughts and concerns. If employees feel as though they have a voice in organisational policies and decisions, they are more likely and willing to exercise their voice to improve organisational conditions that can impact their work and their team.30
Allyship
- Encourage leaders to prioritise team-building and mutual understanding. Organisational and team cultures that promote active listening, care, and understanding lay the groundwork for employees to develop empathy31 and connect across difference.
Acknowledgements
We thank our donors for their generous support of our work in this area:
Lead for Equity and Inclusion
Lead Donor

Major Donors


![]()

Partner Donors
- The Coca-Cola Company
- Dell
- KeyBank
- KKR
- KPMG
- UPS
Supporter Donor
- Pitney Bowes Inc.
How to Cite: Shaffer, E. (2021). The trust gap: The impact on employees in Europe. Catalyst.
Endnotes
- Edmondson, A. C. (2004). Psychological safety, trust, and learning in organizations: A group-level lens. In R. M. Kramer & K. S. Cook (eds.), The Russell Sage Foundation series on Trust. Trust and distrust in organizations: Dilemmas and approaches (p. 239-272). Russell Sage Foundation.
- Travis, D. J., Shaffer, E., & Thorpe-Moscon, J. (2019). Getting real about inclusive leadership: Why change starts with you. Catalyst.
- Travis, Shaffer, & Thorpe-Moscon (2019).
- An exploratory factor analysis examined 5 items used to measure employees’ experience of trust. The KMO was .85, indicating that the sample was adequate, and Bartlett’s test of sphericity was significant, Χ2 (10) = 3417.08, p < .001. A single factor solution was found indicating all five items represented one construct that explained 62.5% of the variance. Factor loadings ranged from .71 to .77 for each of the five items. The highest factor loading (.77) was associated with the item “At work, my colleagues invite me to participate in decision-making,” and the second-highest factor loading was associated with, “At work, I am trusted to contribute to organizational goals” (.74). Each of the five items were measured on a scale of 1 (never) to 5 (always). The five items were then averaged to create a composite.
- See, for example: Davidson, M. N. & Ferdman, B. M. (2002). Inclusion: What can I and my organization do about it? The Industrial-Organizational Psychologist, 39(4), 80-85; Mor Barak, M. E., & Cherin, D. A. (1998). A tool to expand organizational understanding of workforce diversity. Administration in Social Work, 22(1), 47-64.
- Mor Barak, M. E. (2017). Managing diversity: Toward a globally inclusive workplace. SAGE Publications.
- Mor Barak (2017).
- Coppola, M., Hatfield, S., Coombes, R., & Nuerk, C. (2018). Voice of the workforce in Europe: Understanding the expectations of the labour force to keep abreast of demographic and technological change. Deloitte.
- An independent samples t-test examined whether men and women reported differing levels of trust. The difference was significant, t (1714) = 2.65, p < .01. Men reported experiencing more trust (M = 3.80, SD = .76) than did women (M = 3.70, SD = .78). There is a significant difference between the percentage of men and percentage of women who report that they often or always experience trust at work, Χ2 (1) = 5.71, p < .05.
- An independent samples t-test examined whether those in non-management positions compared to those in management positions reported differing levels of trust. The difference was significant, t (1735) = -7.40, p < .001. Those in management positions (M = 3.87, SD = .73) reported experiencing more trust than those in non-management positions (M = 3.60, SD = .79). There is a significant difference between the percentage of those in management positions compared to those in non-management positions who report that they often or always experience trust at work, X2 (1) = 53.52, p < .001.
- Employee innovation was measured using five items which were then averaged to create a composite. Each item was measured on a 1 (never) to 5 (always) scale. A hierarchical linear regression analysis tested the impact of trust on employee innovation. Dummy coded gender was entered at Step 1. The overall model was significant, R2 = .01, F (2, 1725) = 6.02, p < .01. At Step 2, the main predictor of interest, trust, was entered. This model was also significant, ΔR2 = .28, ΔF (1, 1724) = 668.09, p < .001. Trust was a significant predictor of employee innovation, b = .53, t (1724) = 25.85, p < .001.
- Employee engagement was measured using five items which were then averaged to create a composite. Each item was measured on a 1 (never) to 5 (always) scale. A hierarchical linear regression analysis examined the impact of trust on employee engagement. Again, dummy coded gender was entered at Step 1. The overall model was significant, R2 = .002, F (2, 1725) = 3.15, p < .05. At Step 2, trust was entered. The Step 2 model was significant, ΔR2 = .35, ΔF (1, 1724) = 926.56, p < .001. Trust was a significant predictor of employee engagement, b = .67, t (1724) = 30.44, p < .001.
- Team innovation was measured using six items which were then averaged to create a composite. Each item was assessed on a 1 (never) to 5 (always) scale. A hierarchical linear regression analysis examined the impact of trust on team innovation. Dummy coded gender was entered at Step 1. This model was significant, R2 = .01, F (2, 1725) = 4.71, p < .01. At Step 2, trusted was entered. This model was also significant, ΔR2 = .24, ΔF (1, 1724) = 561.45, p < .001. Trust significantly predicted team innovation, b = .53, t (1724) = 23.70, p < .001.
- Team citizenship was measured using four items which were then averaged to create a composite. Each item was measured on a 1 (never) to 5 (always) scale. A hierarchical linear regression analysis examined the impact of trust on team citizenship. Dummy coded gender was entered at Step 1. This model was significant, R2 = .004, F (2, 1725) = 3.30, p = .04. At Step 2, the main predictor of interest, trusted, was entered. This model was significant, ΔR2 = .30, ΔF (1, 1724) = 748.36, p < .001. Trust was a significant predictor of team innovation, b = .59, t (1724) = 27.36, p < .001.
- Team problem solving was measured using five items which were then averaged to create a composite. Each item was measured on a 1 (never) to 5 (always) scale. A hierarchical linear regression examined the impact of trust on team problem solving. Dummy coded gender was entered at Step 1. This model was not significant, R2 = .003, F (2, 1725) = 2.46 p = .09. At Step 2, trusted was entered. This model was significant, ΔR2 = .37, ΔF (1, 1724) = 1017.08, p < .001. Trust significantly predicted team innovation, b = .63, t (1724) = 31.89, p < .001.
- Travis, Shaffer, & Thorpe-Moscon (2019).
- Leading inward is composed of three inclusive leadership scales: courage, curiosity, and humility. The scores on each of these three variables were averaged to create a composite. Leading outward is also composed of three inclusive leadership scales: accountability, allyship, and ownership. An average of these scores was computed to create a composite representing leading outward. All questions representing each inclusive leadership scale were measured on a 1 (never) to 5 (scale). For more information about the construction of leading inward and leading outward, see Travis, Shaffer, and Thorpe-Moscon (2019). We examined the impact of leading inward and leading outward on trust by conducting a hierarchical linear regression. At Step 1, dummy coded gender was entered as a predictor. This model was significant, R2 = .005, F (2, 1725) = 4.00 p = .02. At Step 2, both leading inward and leading outward were entered into the model. This model was also significant, ΔR2 = .31, ΔF (2, 1723) = 392.83, p < .001. Both leading inward (b = .16, t (1723) = 4.27, p < .001) and leading outward (b = .41, t (1723) = 10.48, p < .001) significantly predicted trust.
- The standardized coefficient associated with leading outward (ß = .41) was larger than the standardized coefficient associated with leading inward (ß = .17).
- Leading outward was measured on a five-point Likert scale (1 = Never, 5 = Always) and was dichotomized to reflect those who reported that their manager often or always leads outward vs. those who said their manager sometimes to never leads outward. A chi-square analysis was conducted to test for a difference in percentages. The observed values were significantly different from the expected values. X2 (1) = 222.18, p <.001.
- For example, previous research has found that authentic leadership, marked by consistency between a leader’s words and actions was positively related to employee trust. See: Wang, D-S., & Hsieh, C-C. (2013). The effect of authentic leadership on employee trust and employee engagement. Social Behavior and Personality, 41(4), 613-624.
- Similarly, another study found that transformational and consultative leadership both inspire trust. These leadership qualities are displayed by role modeling one’s values and considering the viewpoints and input of employees when making important decisions. See: Gillespie, N. A., & Mann, L. (2004). Transformational leadership and shared values: The building blocks of trust. Journal of Managerial Psychology, 19(6), 588-607.
- A hierarchical linear regression investigated the impact of organizational factors on employees’ experience of trust. At Step 1, dummy coded gender was entered into the model. This model was significant, R2 = .005, F (2, 1725) = 4.00 p = .02. At Step 2, the main predictors of interest— connections with colleagues, procedural fairness, and team cohesion—were entered into the model. This model was also significant, ΔR2 = .50, ΔF (3, 1722) = 583.82, p < .001. All three predictors were significantly related to employees’ experience of trust. Connections with colleagues significantly predicted trust, b = .30, t (1722) = 13.34, p < .001. Procedural fairness was also a significant predictor, b = .11, t (1722) = 4.90, p < .001. Finally, team cohesion predicted trusted, b = .36, t (1722) = 13.02, p < .001. Connections: Interactions with co-workers are positive, supportive, and trusting. Procedural fairness: Transparent processes and structures ensure that organizational decisions are fair, equitable, timely, and respectful. Team cohesion: Team members are able to connect with one another to achieve a common goal, by listening, acting in the best interest of the team, and engaging in shared work.
- The standardized coefficient associated with team cohesion (ß = .36) was larger than the standardized coefficients for both connections with colleagues (ß = .33) and procedural fairness (ß = .11).
- Team cohesion was measured on a five-point Likert scale (1 = Never, 5 = Always) and was dichotomized to reflect those who reported that their team was often or always cohesive vs. those who said their team was sometimes to never cohesive. A chi-square analysis was conducted to test for a difference in percentages. The observed values were significantly different from the expected values. X2 (1) = 384.77, p <.001.
- Employee engagement and employee innovation were averaged to create a composite variable representing employee outcomes. A mediation analysis was performed using Hayes’ PROCESS macro. The relationship between team cohesion and employee outcomes was mediated by trust. The total effect of team cohesion on employee outcomes was significant, b = .58, SE = .02, t (1735) = 33.27, p < .001, indicating that higher ratings of team cohesion lead to more positive employee outcomes. The relationship between team cohesion and trust was also significant, (b = .67, SE = .02, t (1735) = 36.95, p < .001), indicating that higher ratings of team cohesion are positively related to employees’ experience of trust. The relationship from trust to employee outcomes was also significant, (b = .39, SE = .02, t (1734) = 18.58, p < .001), indicating that more trust is associated with more positive employee outcomes. Finally, the direct effect between team cohesion and employee outcomes was significant with trusted in the model, (b = .32, SE = .02, t (1734) = 14.91, p < .001). The indirect effect (b = .26) was statistically significant [LLCI = .22, ULCI = .31] providing evidence of partial mediation.
- Team innovation, team problem solving, and team citizenship were averaged to create a composite variable representing team outcomes. Team outcomes was used in the following analysis. The relationship between team cohesion and team outcomes was also mediated by trust. The total effect of team cohesion on team outcomes was significant, b = .75, SE = .01, t (1735) = 52.02, p < .001, indicating that higher ratings of team cohesion lead to more positive team outcomes. The relationship between team cohesion and trust was also significant, (b = .67, SE = .02, t (1735) = 36.95, p < .001), indicating that higher ratings of team cohesion are positively related to employees’ experience of trust. The relationship from trust to team outcomes was also significant, (b = .16, SE = .02, t (1734) = 8.59, p < .001), indicating that more trust is associated with more positive team outcomes. Finally, the direct effect between team cohesion and employee outcomes was significant with trusted in the model, (b = .64, SE = .02, t (1734) = 34.02, p < .001). The indirect effect (b = .11) was statistically significant [LLCI = .08, ULCI = .14] providing evidence of partial mediation.
- The relationship between leading outward and employee outcomes was mediated by trust. The total effect of leading outward on employee outcomes was significant, b = .55, SE = .02, t (1735) = 30.75, p < .001, indicating that higher ratings of leading outward lead to more positive employee outcomes. The relationship between leading outward and trust was also significant, (b = .55, SE = .02, t (1735) = 27.89, p < .001), indicating that higher ratings of leading outward are positively related to employees’ experience of trust. The relationship from trust to employee outcomes was also significant, (b = .43, SE = .02, t (1734) = 22.88, p < .001), indicating that more trust is associated with more positive employee outcomes. Finally, the direct effect between leading outward and employee outcomes was significant with trusted in the model, (b = .31, SE = .02, t (1734) = 16.42, p < .001). The indirect effect (b = .24) was statistically significant [LLCI = .20, ULCI = .27] providing evidence of partial mediation.
- The relationship between leading outward and team outcomes was also mediated by trust. As stated above, total effect of leading outward on team outcomes was significant, b = .59, SE = .02, t (1735) = 33.50, p < .001, indicating that higher ratings of leading outward lead to more positive team outcomes. The relationship between leading outward and trust was also significant, (b = .55, SE = .02, t (1735) = 27.89, p < .001), indicating that higher ratings of leading outward are positively related to employees’ experience of trust. The relationship from trust to team outcomes was also significant, (b = .36, SE = .02, t (1734) = 18.58, p < .001), indicating that more trust is associated with more positive team outcomes. Finally, the direct effect between team cohesion and employee outcomes was significant with trusted in the model, (b = .39, SE = .02, t (1734) = 20.13, p < .001). The indirect effect (b = .20) was statistically significant [LLCI = .17, ULCI = .24] providing evidence of partial mediation.
- Travis, Shaffer, & Thorpe-Moscon (2019).
- Travis, D. J. & Mor Barak, M. E. (2010). Fight or flight? Factors influencing child welfare workers’ propensity to seek positive change or disengage from their jobs. Journal of Social Service Research, 36(3), 199-205.
- Why empathy is a superpower in the future of work. (2020). Catalyst.